I assume that every developer likes to know how the things that they make are being used by those who use it, to some extent.
In the mobile app world, it isn’t the best idea to track every move the user makes, but you could do it, if you plan on making your customers a little annoyed with you. At a minimum app developers can track the number of downloads for the app through statistics provided by the app vendor. This is extremely important if the app brings in money and you want to verify with the vendor that you received everything you should have from each download (including in app purchases). A happy medium would be to put some cookie on your app to let your own secure server know when the user used the app and combine that data with the download information. This way, you can determine if there are a good number of downloads and that people are still interested in using your app and not just downloading it and letting it sit idle on your phone. There are 3rd party companies that will also do this for you, but I am a little hesitant to give them that access to my apps.
I would like to stress, that the happy medium requires that you create a secure data transmission from your app to your web server, because most likely you will be storing a small portion of personal information from the user. And any amount of data gleaned from your users should be handled with care.
I don’t have the hook in any of my apps to do the happy medium, but I might do that in the future. For now, I am just looking at the data from the download reports I get from BlackBerry Vendor Portal. In the Vendor Portal, you can see current reports and such, but I prefer the ease of having all of my data available to me for manipulation. Luckily, the Vendor Portal allows for csv downloads of data and I try to get each month’s data at the start of the new month. After I download it, I import it into a database and use some PHP script to get the data into some charts.
For my charts, I looked around for some free JavaScript/HTML5/JScript based charts to display my data. After taking a look at a few, I settled on Chart.js. It seemed to have a lot of features, was easy to set up and get data displayed. It also had some customization of the charts and worked great on both my site and my Passport. BlackBerry had removed Adobe Flash from its browser and I needed an HTML5 alternative. Obviously, if Adobe Flash wasn’t dying on the vine, I would have gladly made my charts using Adobe Flex.
Chart.js was working out great, then I tried to make some changes and ran into a very annoying error. While I first had a simple set of charts based on the current year, I decided to make it so that the month and year could be changed to have a little more flexibility in the chart data. After working through the script to get the form option working (I’m still not happy with the results on how the form is displayed), I started getting errors on the display. First, I had to make sure that the data was getting more than the current month and year, so I made sure all the sql queries were updated to use the comparative operator. In this case, I changed it from less than to less than and equal to the month. This gives me the month selected and everything before it for the selected year.
$sql1 = "SELECT DISTINCT `phoneOS` FROM `ApplicationStats`
WHERE YEAR(`downloadDateTime`) = " . $thisYear . "
AND MONTH( `downloadDateTime` ) <= " . $thisMonth . "
ORDER BY `phoneOS`";
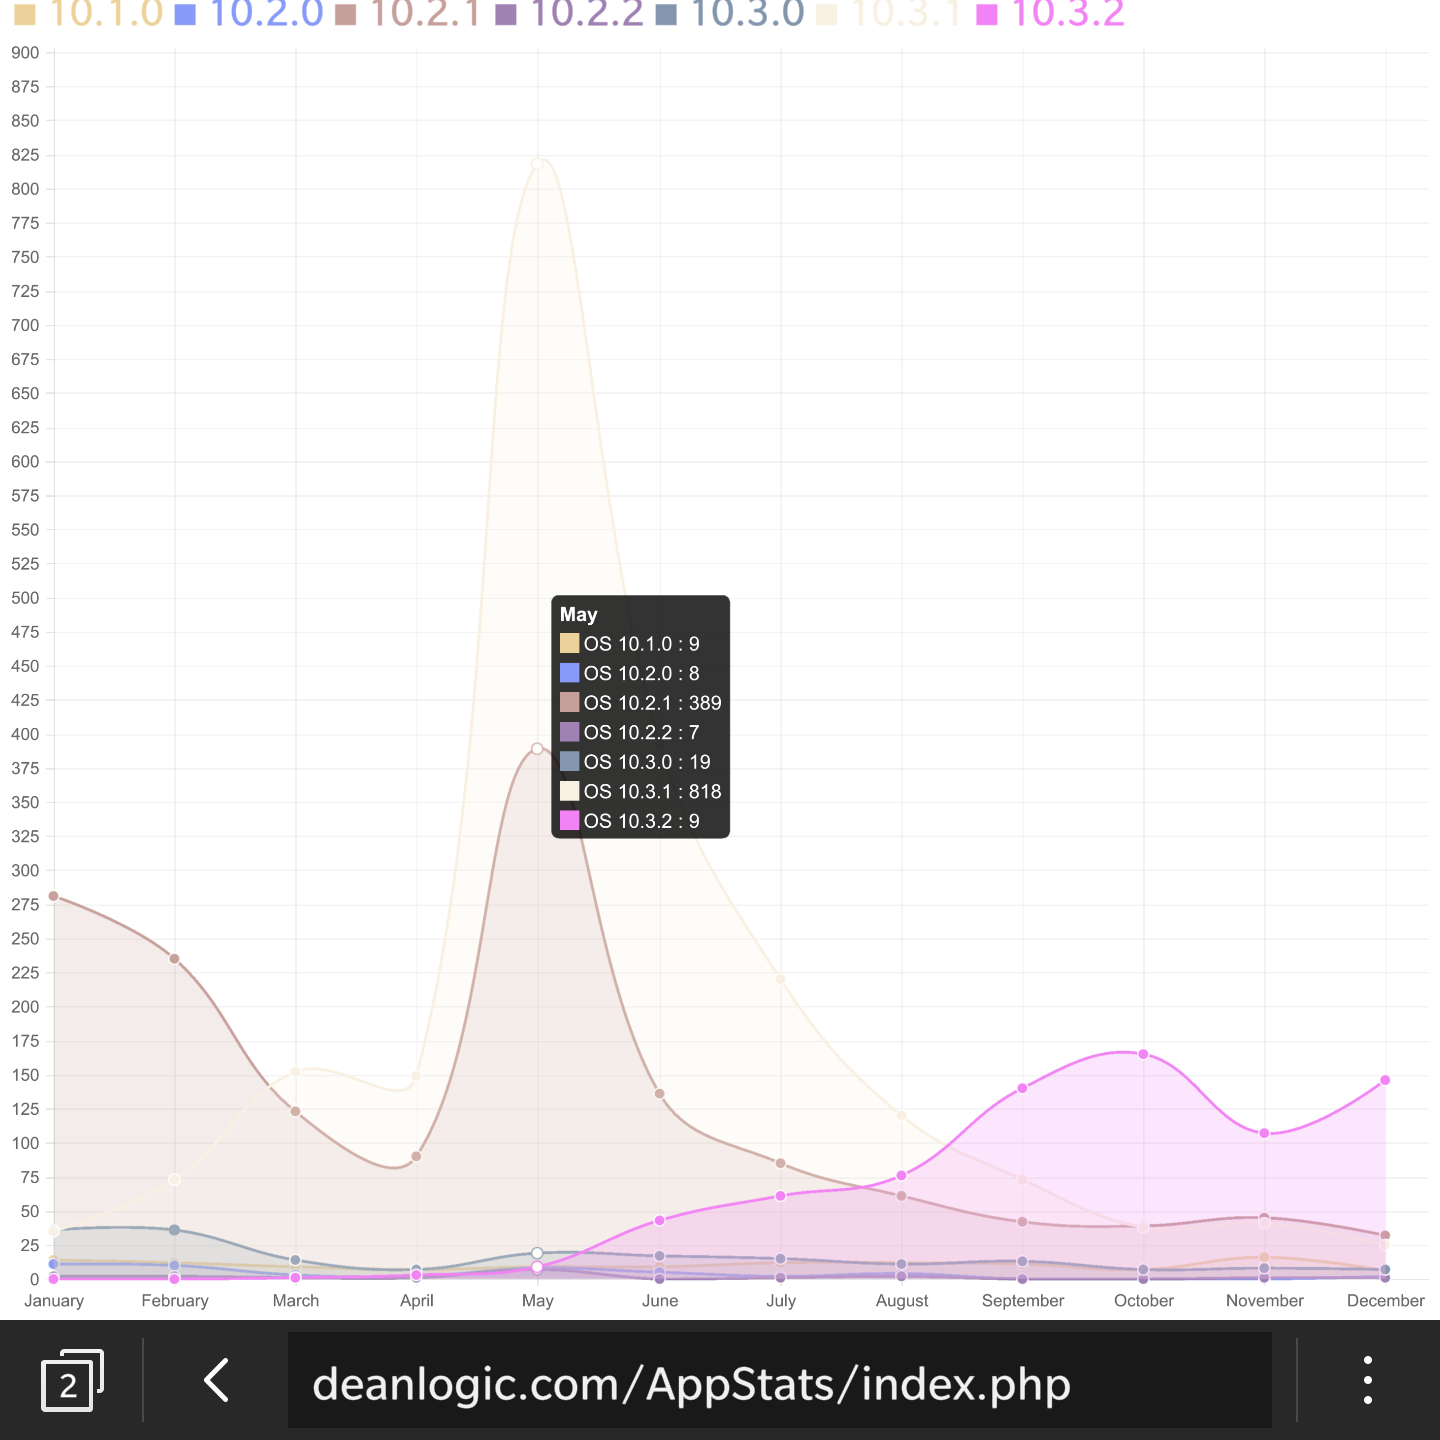
After this was worked out, I tried to customize the tip tool for the chart, so that the viewer wouldn’t have to keep looking at a legend in order to figure which color was what. For a line chart with multiple data sets, you have to use multiTooltipTemplate to customize the tip tool. According to the documentation, it was simple as adding a parameter to the chart array.
multiTooltipTemplate: "<%= datasetLavel %> + " : " + <%= value %>",
Unfortunately, this did nothing but display the text I put in between the % signs. After attempting different ways of handling the option, I did what any developer does, search the web for an answer. I also found on Chart.js Github repository that others had the issue.
I did find a few answers on StackOverflow, but none of them resolved my issue. When these didn’t work, I looked deeper into the comments and found this solution, which at first didn’t make sense to me. Why would I create a function in a parameter array to display some text? But, since every other effort had failed, I gave it a try and came up with this solution.
multiTooltipTemplate: function(chartData) {return chartData.datasetLabel + " : " + chartData.value;},
And it worked.
The overall code for the chart looks like this code below. I am calling a PHP function to return the data array into the labels and the datasets and it places them into a div labeled languageByMonth.
var ctx = document.getElementById("languageByMonth").getContext("2d");
var myNewChart = new Chart(ctx).Line({
	labels: [<?php getMonthArray($thisMonth]); ?>],
	datasets: [<?php echo join($languageByMonthDS, ',') ?>]
},
{
	showTooltips:true,
	multiTooltipTemplate: function(chartData) {return chartData.datasetLabel + " : " + chartData.value;},
});
I still don’t understand why the documented way didn’t work, but I guess it doesn’t matter since this work around does seem fairly simple. I still need to tweak the charts some more and possibly change the date to a date range, in order to get multi-year charts. Hopefully I can find some more data to use with Chart.js, because it does create a nice display.
About DeanLogic
Dean has been playing around with programming ever since his family got an IBM PC back in the early 80's. Things have changed since BASICA and Dean has dabbled in HTML, JavaScript, Action Script, Flex, Flash, PHP, C#, C++, J2ME and SQL. On this site Dean likes to share his adventures in coding. And since programming isn't enough of a time killer, Dean has also picked up the hobby of short film creation.